Every planner has watched it happen. The programme is healthy, the bars are moving, the S-curve looks respectable — and then the last ten percent of the job turns into a swamp. Commissioning, testing, statutory inspections, handover certificates. The bar chart that served you faithfully for two years suddenly tells you almost nothing, and the weekly meeting becomes an argument about what “done” means.
This isn’t a failure of your schedule. It’s a category error about what kind of work you’re tracking.
Bars track time. Gates track state.
A construction activity is a quantity of work spread over a duration. Percent complete means something: half the concrete is poured, sixty percent of the cable is pulled. A bar chart is the right picture, because the question is how far along.
Approvals work is different. A fire services inspection is not forty percent passed. A test certificate is not mostly signed. Each step is a gate: you are on one side of it or the other, and the only honest statuses are not started, awaiting someone, passed on this date. Ask “what percent complete is the Occupation Permit?” and you get the swamp — an answer that sounds like progress and contains none.
When you track gate-work with a bar chart, you force binary facts into a percentage costume. That costume is where the trouble lives: bars at “90%” for six weeks, meetings that re-litigate the same status, and the real blocker — one unsigned test sheet — invisible inside a rolled-up bar.
The picture that works: lanes and gates
The tool that fits gate-work is old, unfashionable and effective: a process diagram. One lane per system, area or submission; one shape per gate, in sequence. For commissioning, a lane might read:
construction complete → pre-comm checks → cold commissioning → hot commissioning → punch closure → handover certificate → start-up
For a statutory submission: application lodged → documents accepted → inspection booked → inspection passed → certificate issued. For an Inspection and Test Plan, the gates are the hold and witness points you already have.
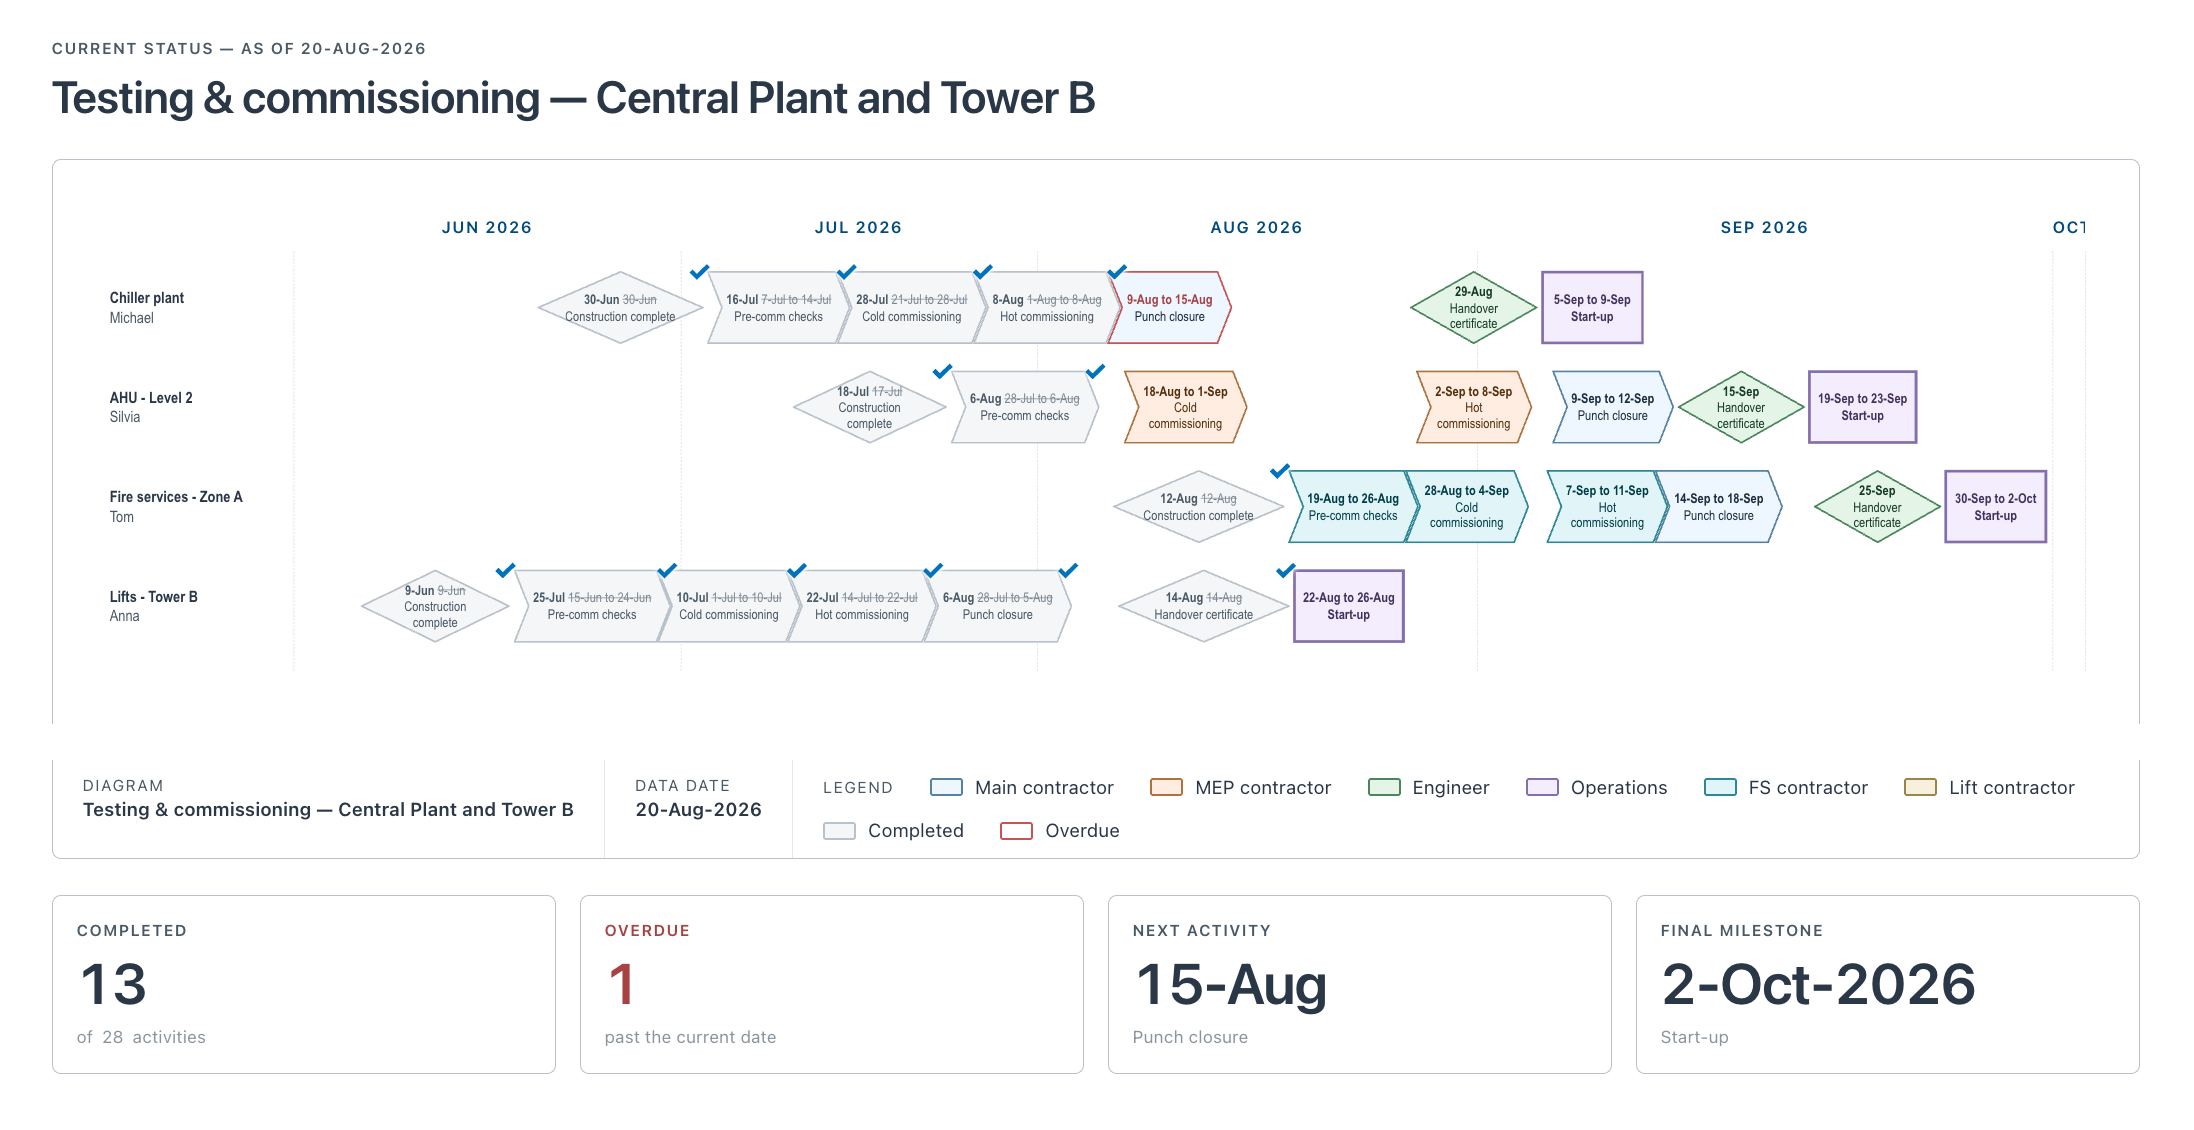
Three rules turn the picture into a tracker:
A gate is ticked only when the evidence exists. The signed test sheet, the punch list at zero, the certificate PDF. Not when someone says it’s done, not when the meeting agrees it’s “basically done”. The tick carries the actual date. This single rule ends the ninety-percent swamp, because there is no ninety percent — there is a date or a blank.
Every un-ticked gate has a planned date and an owner. The moment today’s date passes the planned date, the gate is overdue — not “amber”, not “being progressed” — overdue, with a name attached. Your meeting agenda writes itself: skip everything ticked, discuss the overdue gates, ask each owner one question. Meetings shrink; the argument about what “done” means disappears, because done was defined when you drew the gate.
Punch closure gets its own gate. Fold it into “commissioning complete” and it becomes everyone’s job, which is no one’s job. Give it a shape and an owner and watch how differently it behaves.
Keep the schedule. Change the conversation.
The diagram doesn’t replace your programme — the schedule still owns time, logic, and the forecast; the gates still appear in it as milestones where they matter. What the diagram replaces is the status conversation. A site manager who will not read a Gantt chart will point at a shape and say “we’re stuck here, waiting on the lift contractor’s certificate”. That sentence, in the room, from the person who owns it, is worth more than any float report.
The division of labour is clean: bars for time, gates for state. Use each for what it measures, and the last ten percent of the job stops being a swamp and becomes a checklist with dates on it.
The same method, whatever you build
Everything above is written in construction vocabulary because that’s where the examples are sharpest — but the method belongs to gate-work itself, not to any industry. A refinery turnaround runs on it: permit issued → isolation confirmed → inspection complete → reinstatement → leak test → handover to operations. So does a pharma qualification: protocol approved → IQ → OQ → PQ → report signed. A utility outage, a rail possession, an aircraft delivered through its certification steps — anywhere the honest statuses are waiting, blocked, or passed on a date, lanes and gates beat bars. If your gates have different names, the three rules don’t change.
Doing this on paper, in a spreadsheet, or in a tool
You can run this with a whiteboard and discipline, and for one small system you probably should. A spreadsheet works too: one row per lane, one column per gate, dates in the cells, conditional formatting for overdue — the method is the point, not the software. The spreadsheet version starts to creak when the diagram needs to be seen: shared with a team, walked through in a meeting, issued as a snapshot with last week’s version kept for the record.
That’s the job Cycleclose™ - Process Tracker was built for — and it’s what drew the diagram above: lanes and gates on a timeline, ticked with actual dates against the planned ones, overdue flagged automatically, completed work dropping back to grey so the live work carries the colour, and point-in-time snapshots you can share with anyone — no account needed at their end. There’s a free evaluation edition — the complete tool, no time limit, as a shared Google Sheet or an installed desktop app. If you only take one thing from this page, though, take the method — it works in any medium that shows lanes, gates and dates.